Statistics
Tier Note
KPI cards and histogram are available to all tiers. The per-question analysis (discrimination index) and class progression statistics are Professional and Enterprise features.
The Statistics tab provides a comprehensive overview of your exam cohort's performance — from the overall distribution to the analysis of individual questions. Route: Statistics tab in /auswertungen/:examId/submissions.
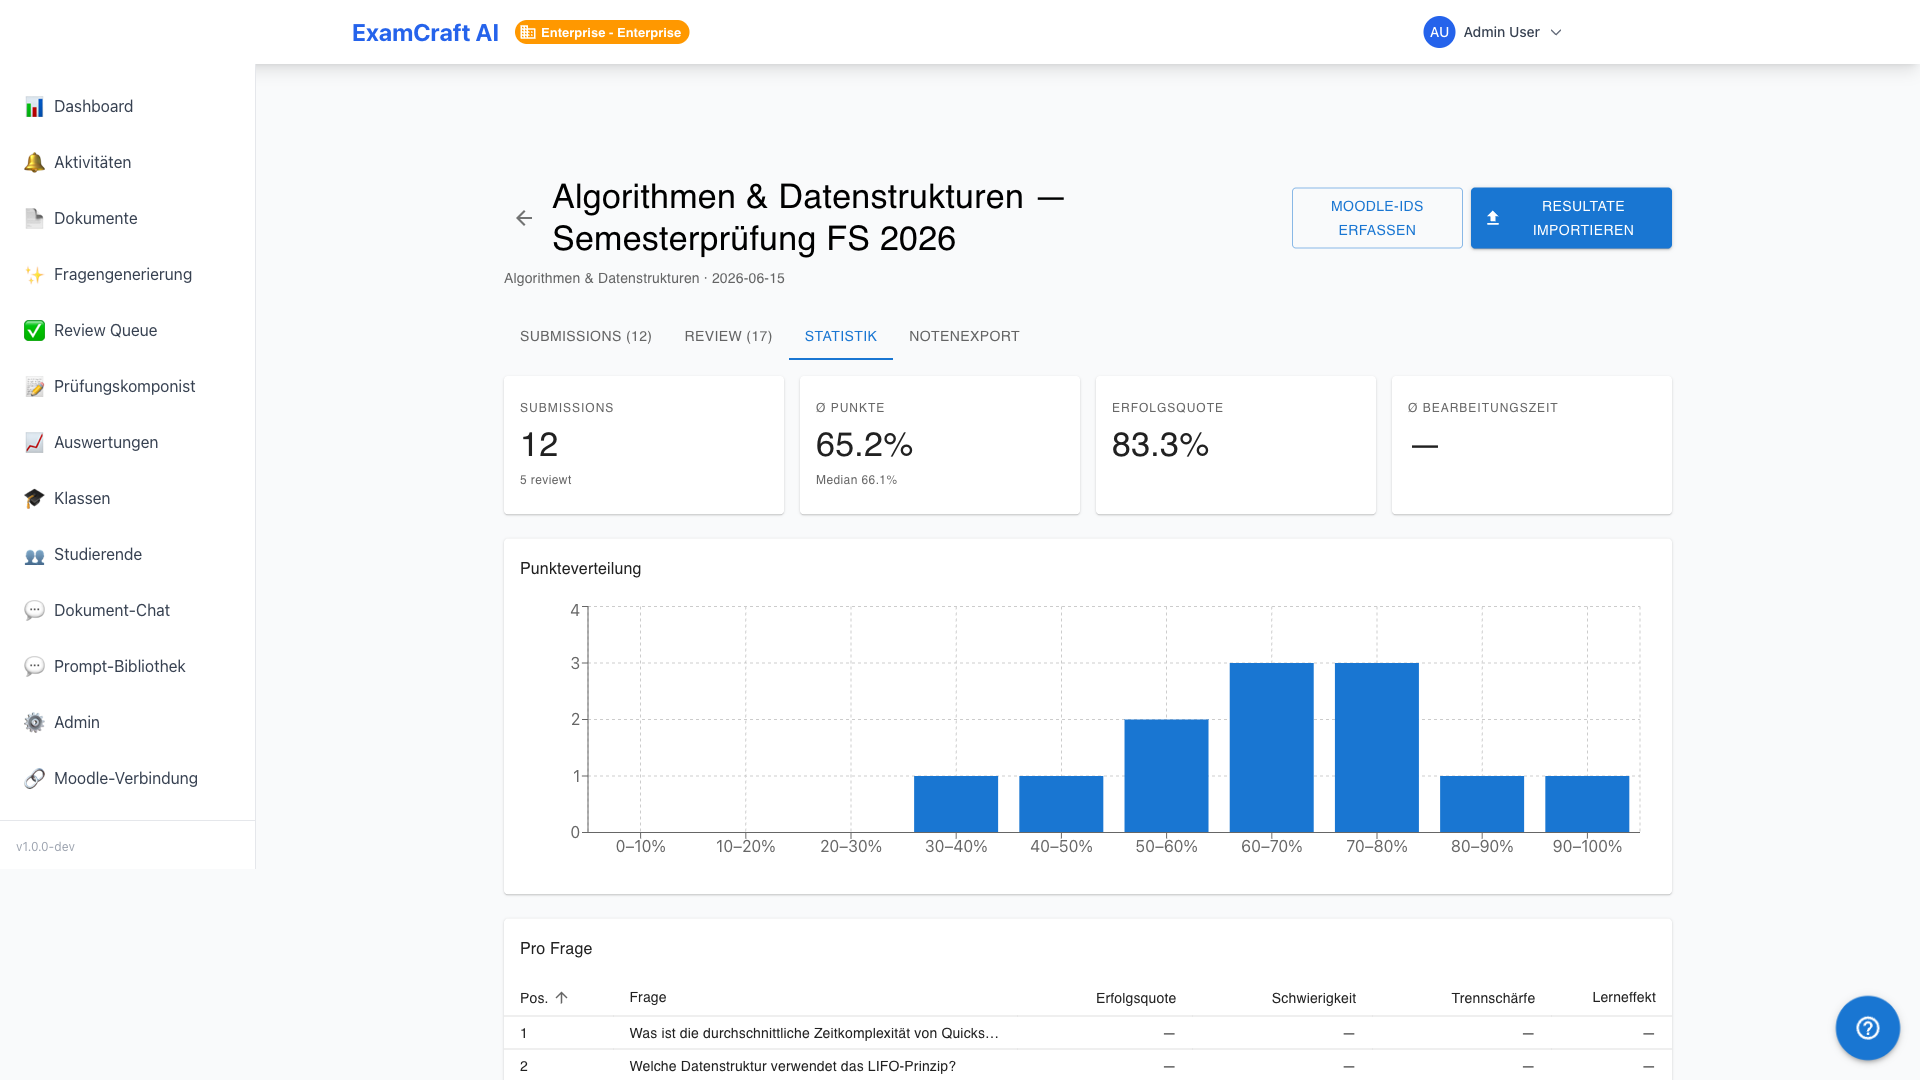
KPI Cards
| Metric | Meaning |
|---|---|
| Average | Mean score across all submissions |
| Pass Rate | Proportion of submissions that reached the passing threshold |
| Submissions | Total number of submissions |
| Reviewed | Number of submissions with status fully_reviewed |
Score Distribution
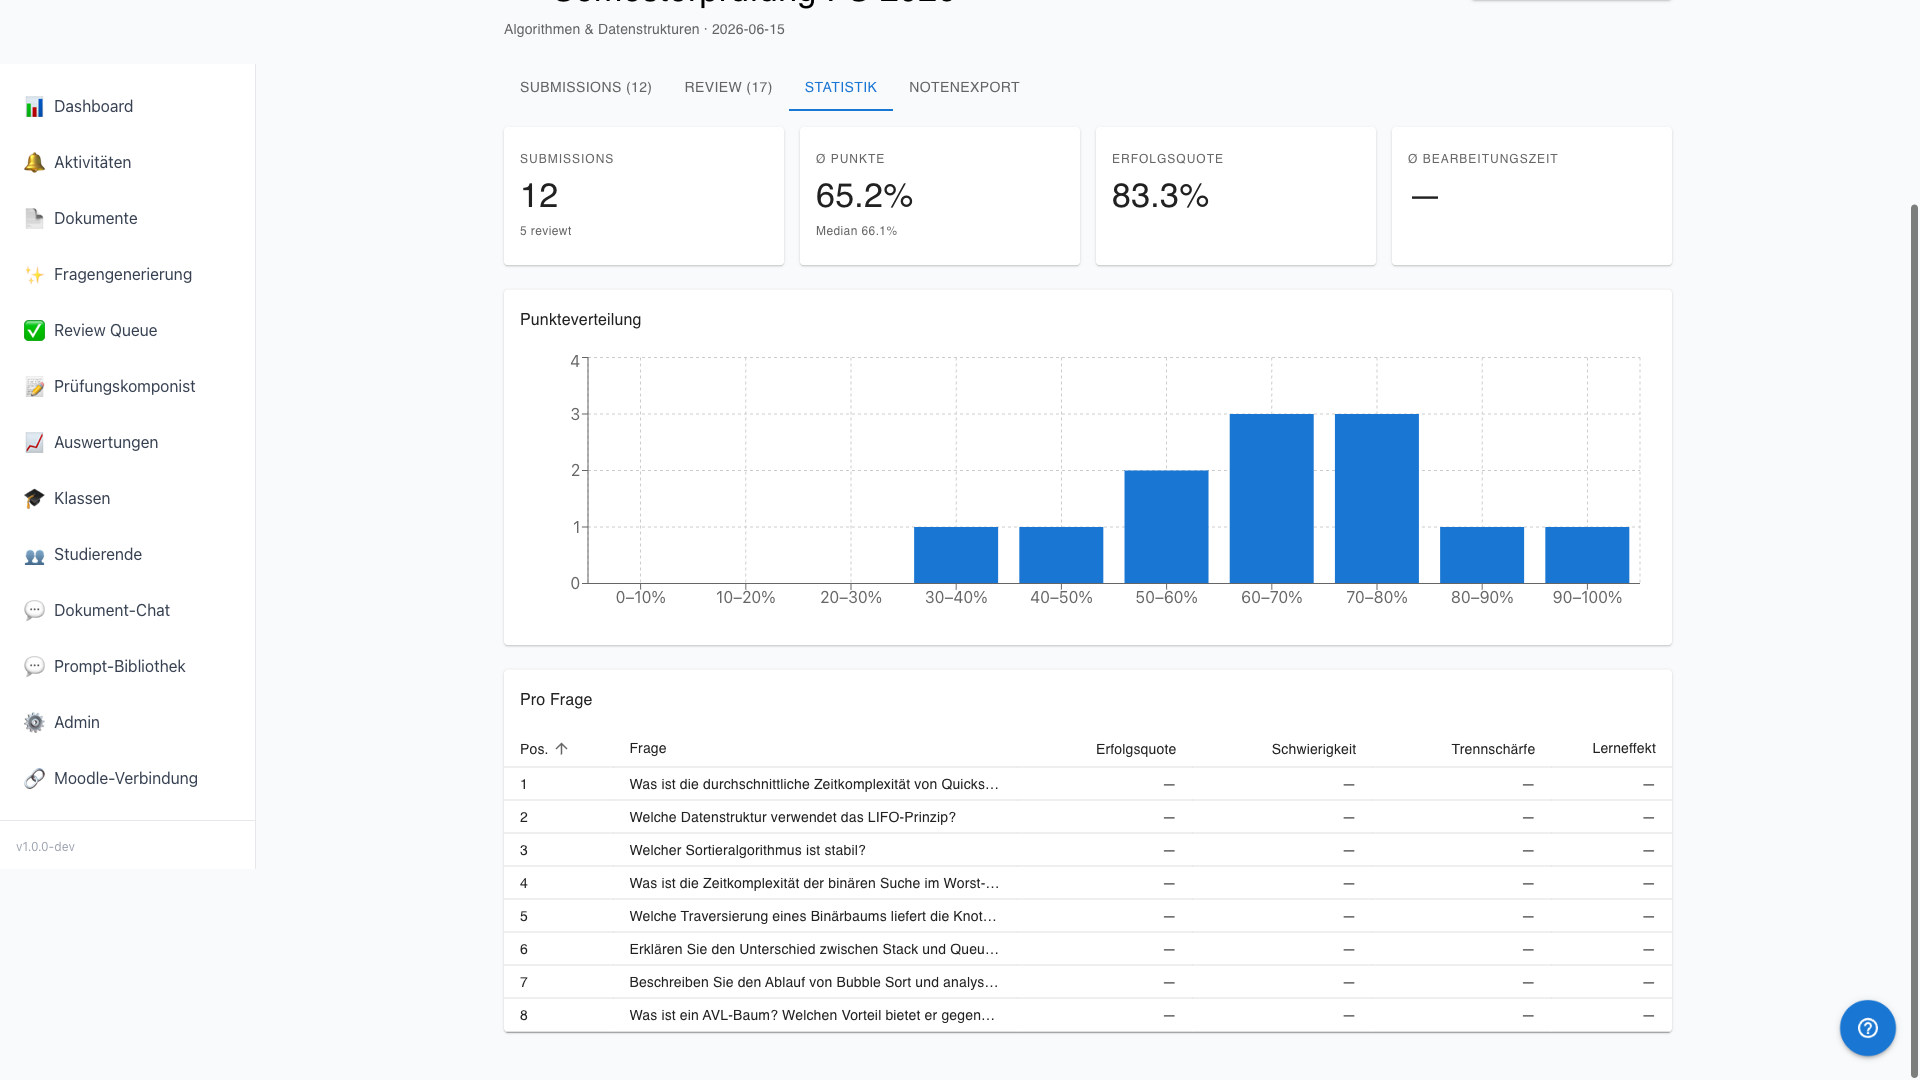
The histogram groups all submissions into 10 % buckets (0–10 %, 10–20 %, …). A steep peak in the middle indicates a well-calibrated exam. A strong left skew may indicate that the questions were too difficult.
Per-Question Analysis
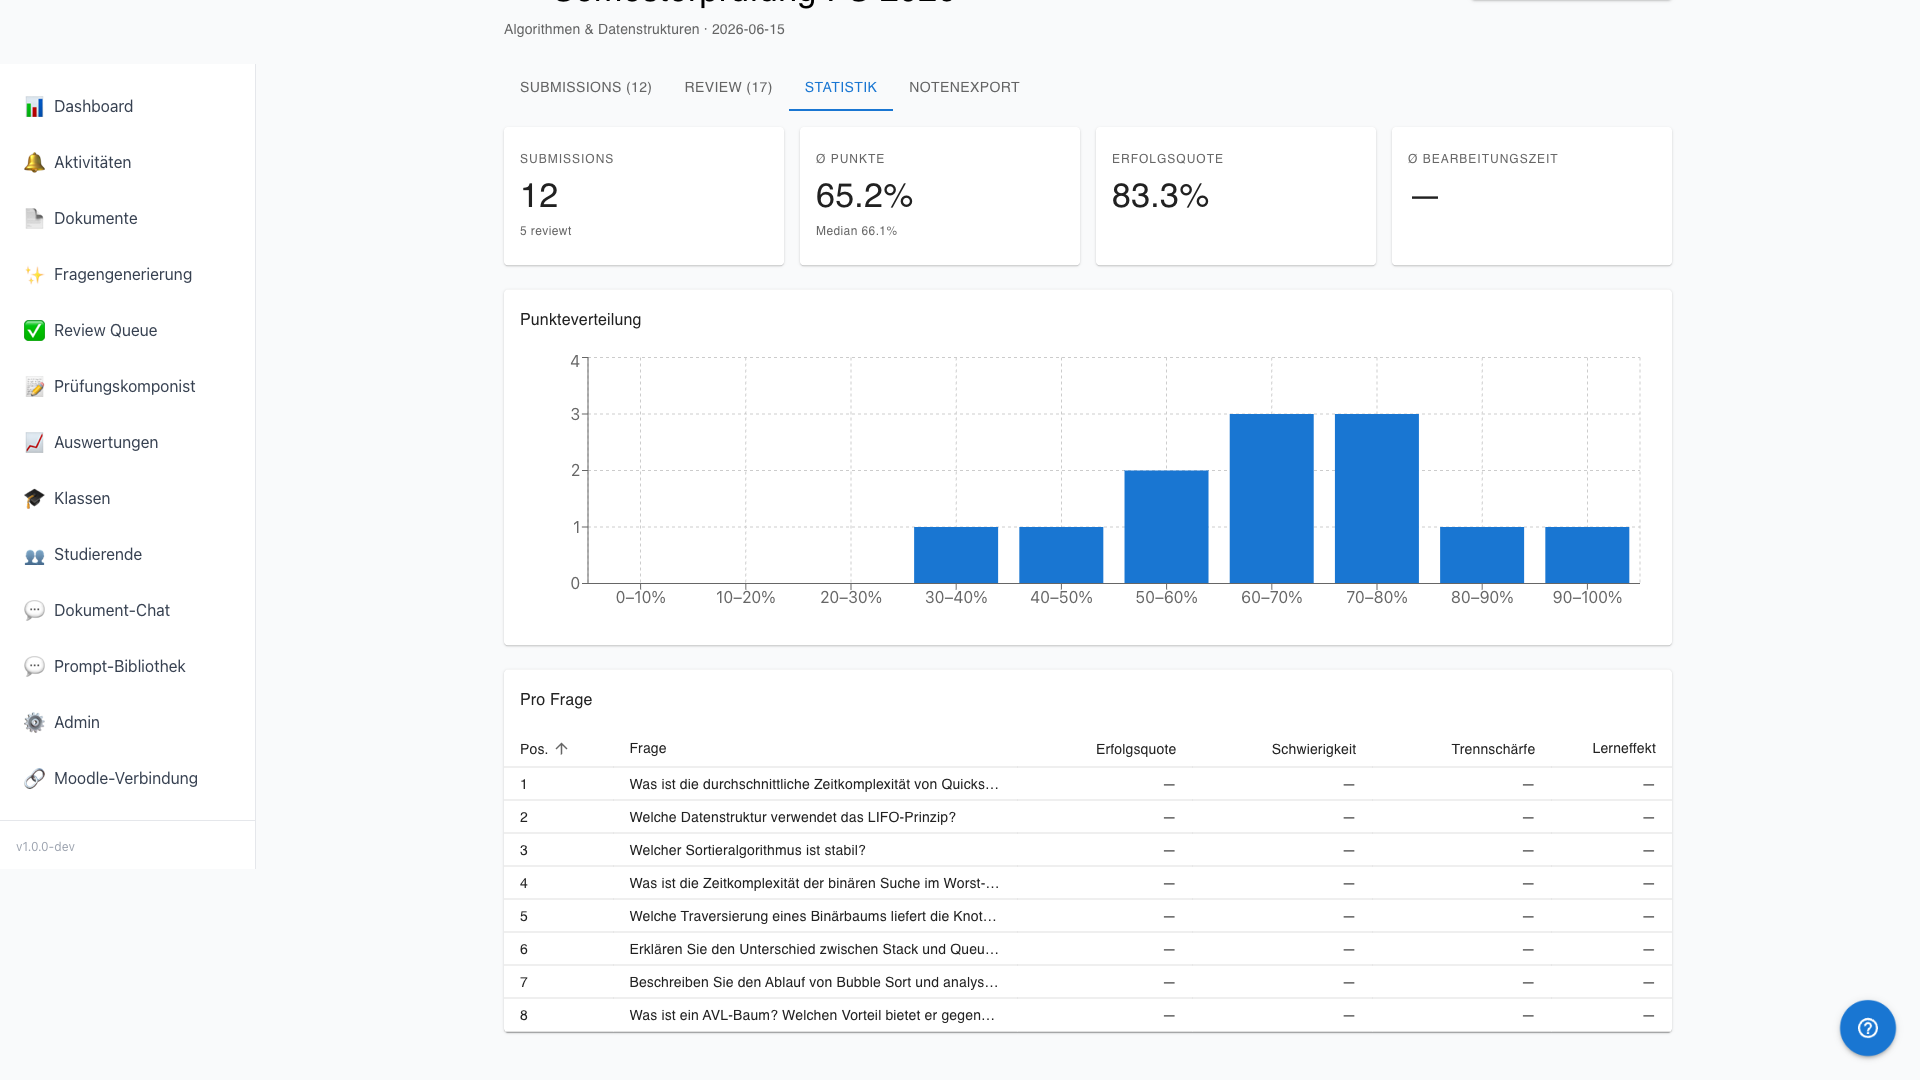
| Column | Description |
|---|---|
| Question | Short text of the question |
| Pass Rate | Proportion of participants with full marks |
| Difficulty | Inverse of pass rate — 100 % means everyone failed |
| Discrimination | How well does this question distinguish strong from weak participants? |
Understanding Discrimination
The discrimination index measures whether a question differentiates between strong and weak participant results:
| Value | Interpretation |
|---|---|
| ≥ 0.40 | Excellent discrimination |
| 0.30–0.39 | Good discrimination |
| 0.20–0.29 | Satisfactory — revision recommended |
| < 0.20 | Weak discrimination — question should be revised or removed |
A negative discrimination index is a warning sign: weaker participants answered the question correctly more often than stronger participants.
Learning Effect for Multiple Attempts
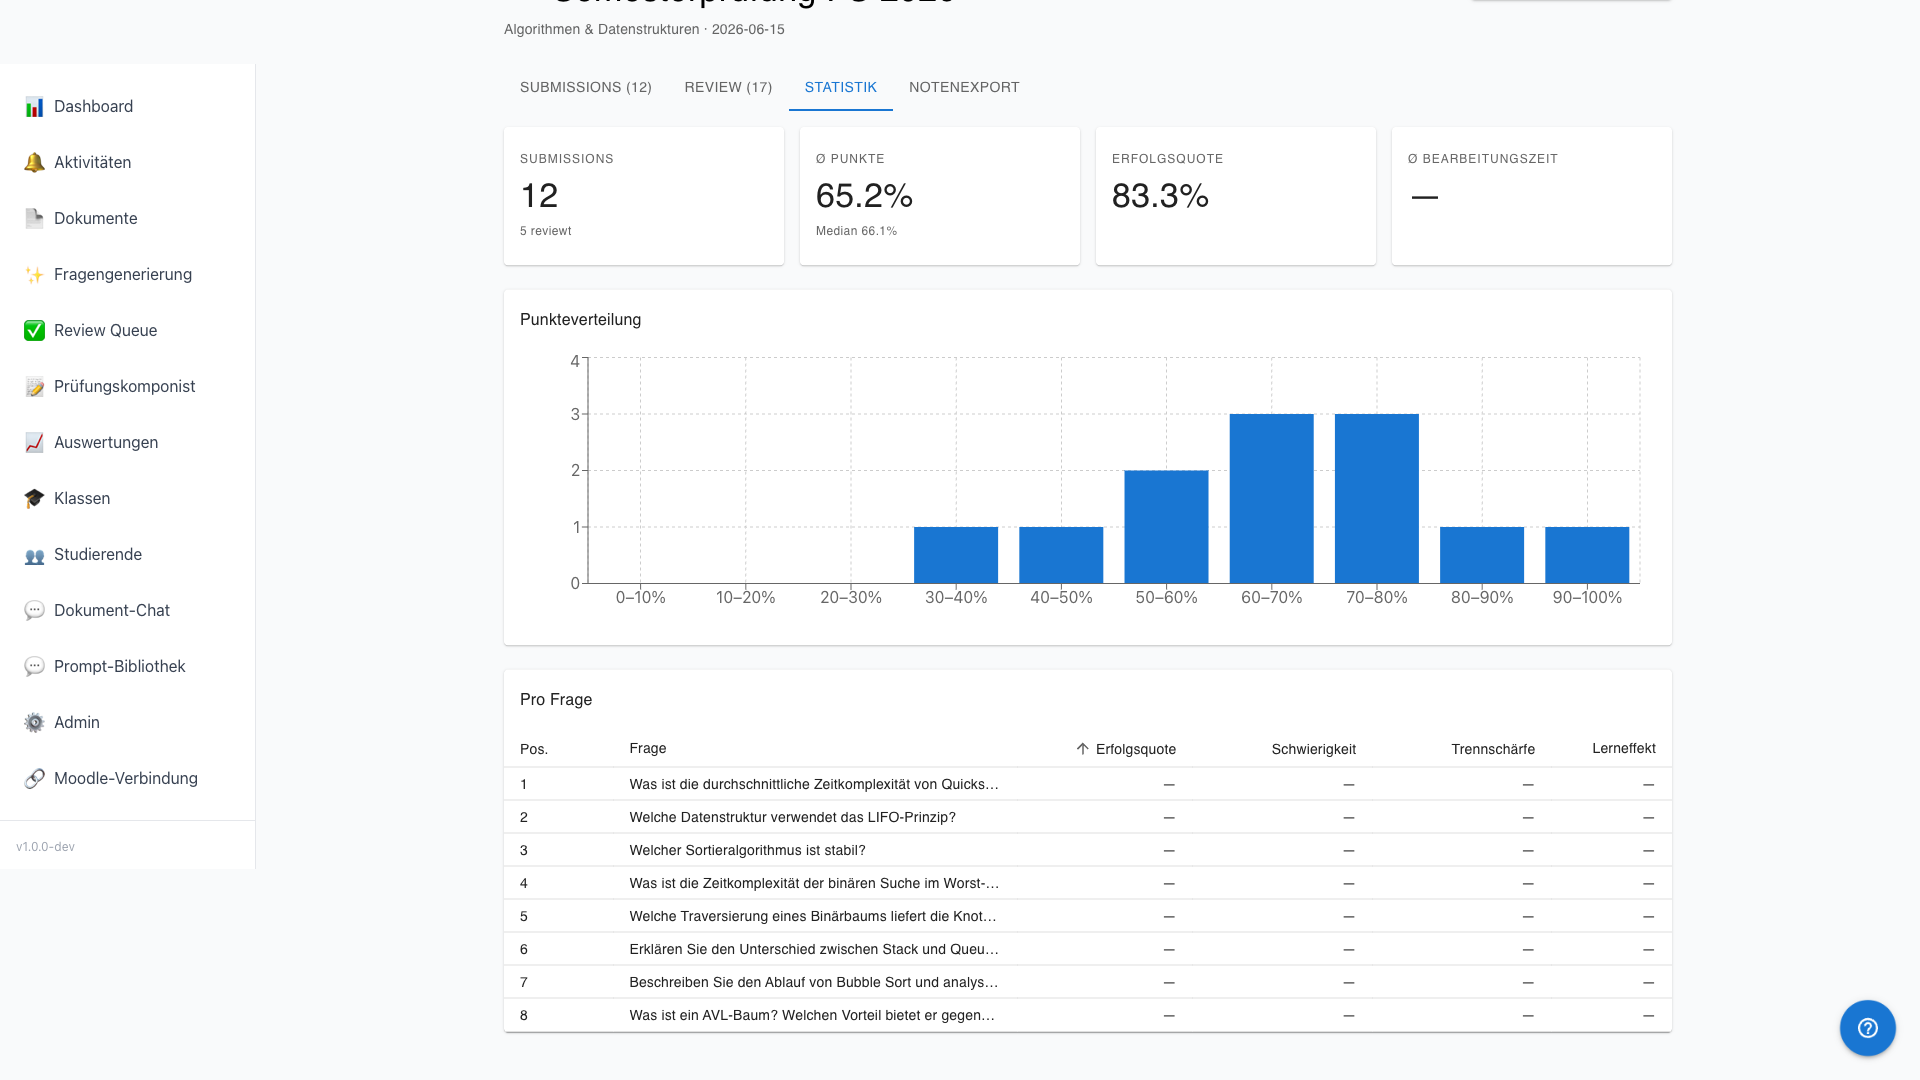
When students sit the same exam multiple times (e.g. for resit exams), this section shows the progression of average scores across attempts. An upward trend confirms a measurable learning effect.